
One of the most important things about creating assessment tools in library settings is to show the value of library services and to make more informed decisions as the library continues to function. The idea of the Space Use project I worked on with colleagues Martin and Alena was to make more informed decisions about the space of the library, but it was also intended to provide useful statistics in whatever capacity they could be used in.


NTK is a large library that caters to a wide variety of patrons, so understanding how the space is used is crucial for the library to maintain its value. The development of this project began in the summer because there are fewer patrons at this time and it allowed for ample time to develop and test the methodology that we used. Keeping in mind the sheer size of the building, we decided to start small and build the project as we discovered what did and did not work. We began our development on floor four of the library and tested and developed our methodology until we were satisfied. This took us several weeks, but we were relatively satisfied with the mock-up we had created. As we went, we also developed a workflow to standardize this project, as other staff would be responsible for implementing it after we were gone (I left in August, prior to the new semester, and Martin was also leaving the division soon).

In our planning of this project, our coordinator, Alena, advised the reading of Gullickson and Meyer’s “Collecting Space Use Data” (2016)* and Martin suggested several web-based techniques to determine our preliminary approach. Beyond this, we used their expertise of the facility itself and my previous experience as a space use observer (which was one of my responsibilities as a student assistant at my university library in the United States).
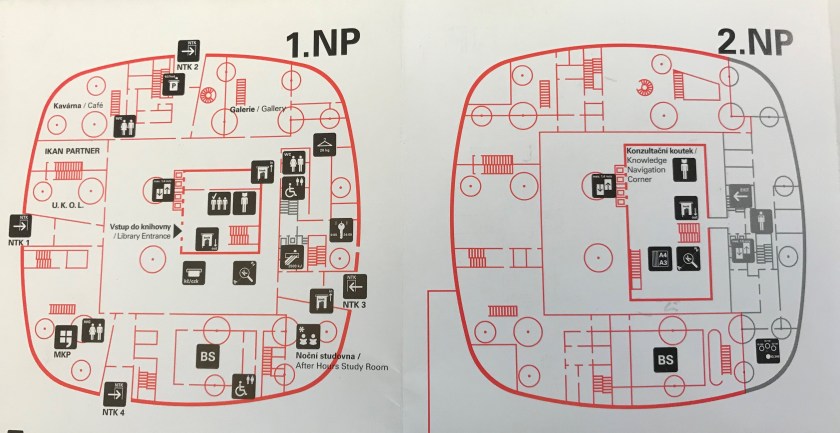
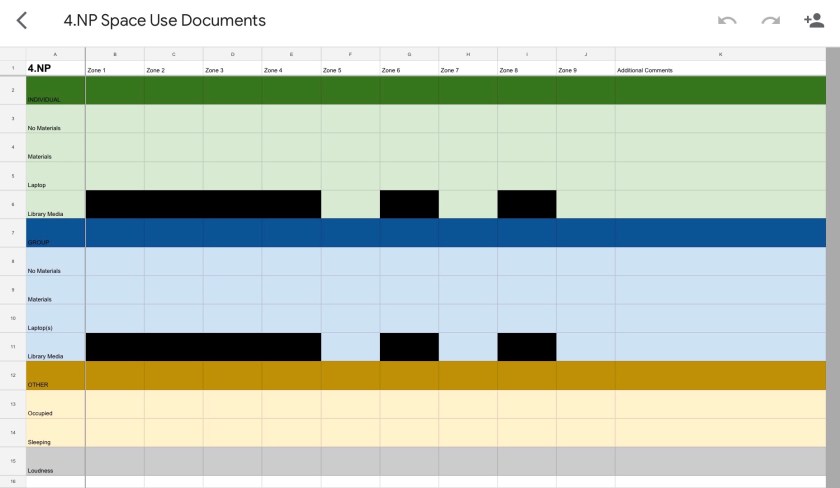
Our original goal with the project was to develop floor plans, a time plan, and determine activities to be observed throughout the project. We wanted to begin with a general approach that could become more specific over time, as routines were developed and patterns began to emerge. One of our problems was that much of the furniture on the floors in movable, so we decided to “zone” each floor into like spaces (such as study tables or relaxing areas). Without a programming background among us, we developed spread sheets for our observations, data entry, and analysis with the hopes of digitizing the process in the future. (It is my understanding that this process has now been started since I left the city).
Several issues were discussed as we tested our project. Should we count occupied seats that did not have people in them? To determine the community engagement of the users, should we use anecdotal observations? Could we incorporate the “gate counts” that were already recorded at the library? As these questions were answered, the project expanded to the third floor as well. With varying layouts, more spreadsheets had to be created to capture all of the data. By the time I left, each of the floors had been prepared for implementation when the students returned for the next semester. We finished my portion of the project by testing the standardization of the process, training other interns to carry out the observations before we ceased observing for the summer.


The last I checked in on the project, it had not been implemented, but an updated timeline had been introduced. They had found someone to create a database for them to store their data for easier recording and analysis, and it was hoped that when the next school semester starts, observations will begin.

*Gullikson, Shelley and Meyer, Kristin. “Collecting Space Use Data to Improve the UX of Library Space.” Michigan Publishing vol. 1, no. 5 (2016).
**Images from the notebook are from my personal notes on my time in Prague.
